
Decoding CodeIQ: A Case Study of How We Helped our Client Speed-up Project Delivery Time
May 24, 2023
Predictive Analytics: A Game-Changer in Healthcare
September 25, 2024
How We Made Observability & Monitoring Simpler, Fast, & Seamless for a Global F&B Giant
__________________________________________________________________________________
This is easily the most challenging project we’ve executed at Seosaph mainly due to the scale and complexity of data involved. It was for one of the largest F&B companies inof the world.
In this article, we outline our journey right from understanding the problem statement, to proposing solutions, through to execution. We also touch base on unique and interesting challenges we’ve had to overcome along the way.
Let’s get started. First, here’s some context for you.
Current Scenario
Our client has hundreds of thousands of processes running across multiple applications on different tools in various geographical regions.
Each of these processes, also called jobs, have several conditional attributes such as Running schedule, Frequency of runs in a day, Action to be taken in cases of delay/failure, and many others.
Manually monitoring each one of these hundreds of thousands of jobs is an impossible task. So, the SOP was to monitor only the 20 odd jobs that were categorized as Critical, which had a direct and huge impact on the business. Every day, a team was responsible to generate and share with the stakeholder status reports of these critical jobs, whereas the statuses of all other non-critical jobs remained out of reach and out of sight. That meant if a non-critical job didn’t run for 6 months, there was no way to identify that.
That brings us to our problem statement.
Problem Statement
Majority of the jobs, even though not critical, do leave an impact on the business, sometimes even leading to sizeable losses when gone unchecked. In their current processes, they had no provision to check the statuses of these jobs. Naturally, this put their entire ecosystem at huge risk. Plus, the dependency on humans to generate the critical jobs’ status reports also made the system weak and dependable.
This was the problem which could give rise to several other problems that could be avoided with a smart system. Now, what did our client want to achieve through such a system?
Objectives
After multiple rounds of discussions with our clients, we distilled their requirements into the following objectives.
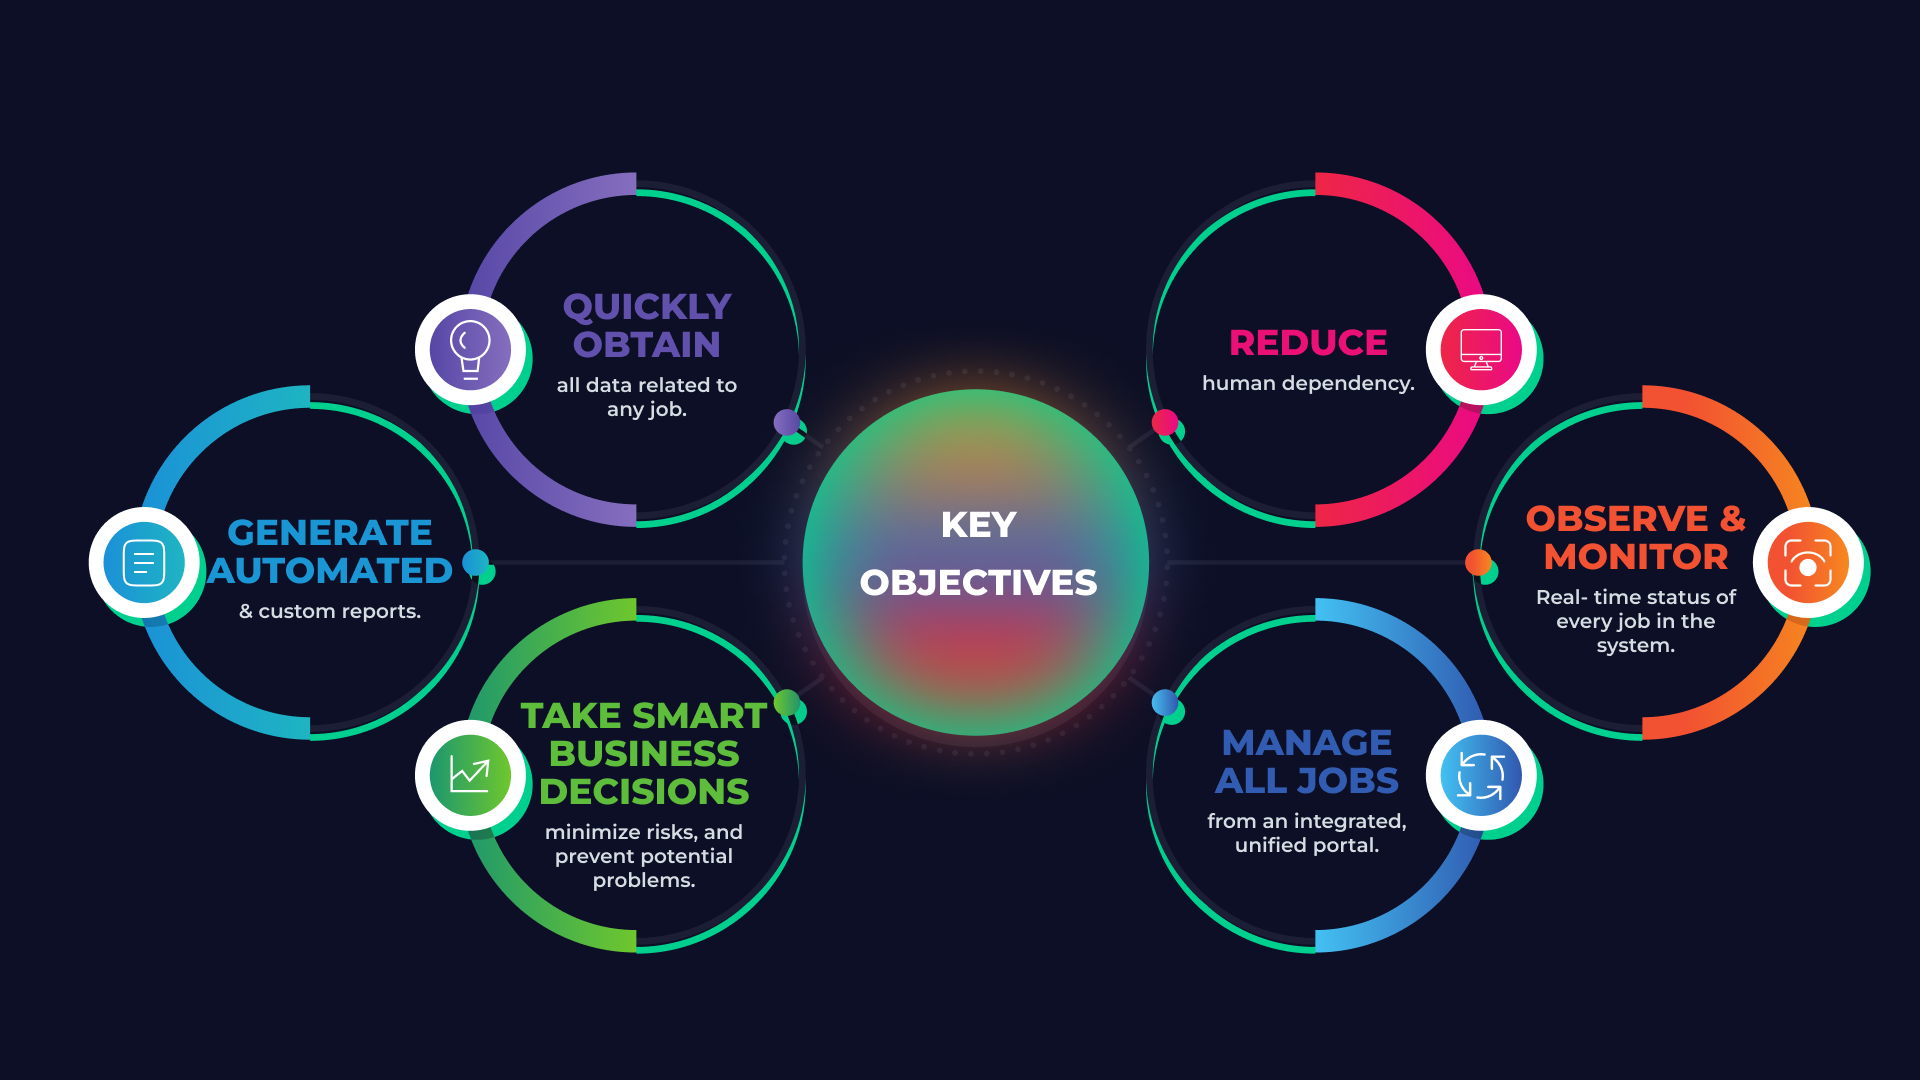
- Reduce human dependency
- Observe and monitor real time status of every job in the system
- Manage all jobs from an integrated, unified portal
- Quickly obtain all data related to any job
- Generate automated and custom reports
- Take smart business decisions, minimize risks, and prevent potential problems
Solution
Having established the objectives, the solution was starting to form in our heads albeit with some haze because the size of data and the number of systems and applications that we were dealing with were enormous. However, with each step forward we gained better clarity. This is the breakdown of project implementation in five simplified steps.
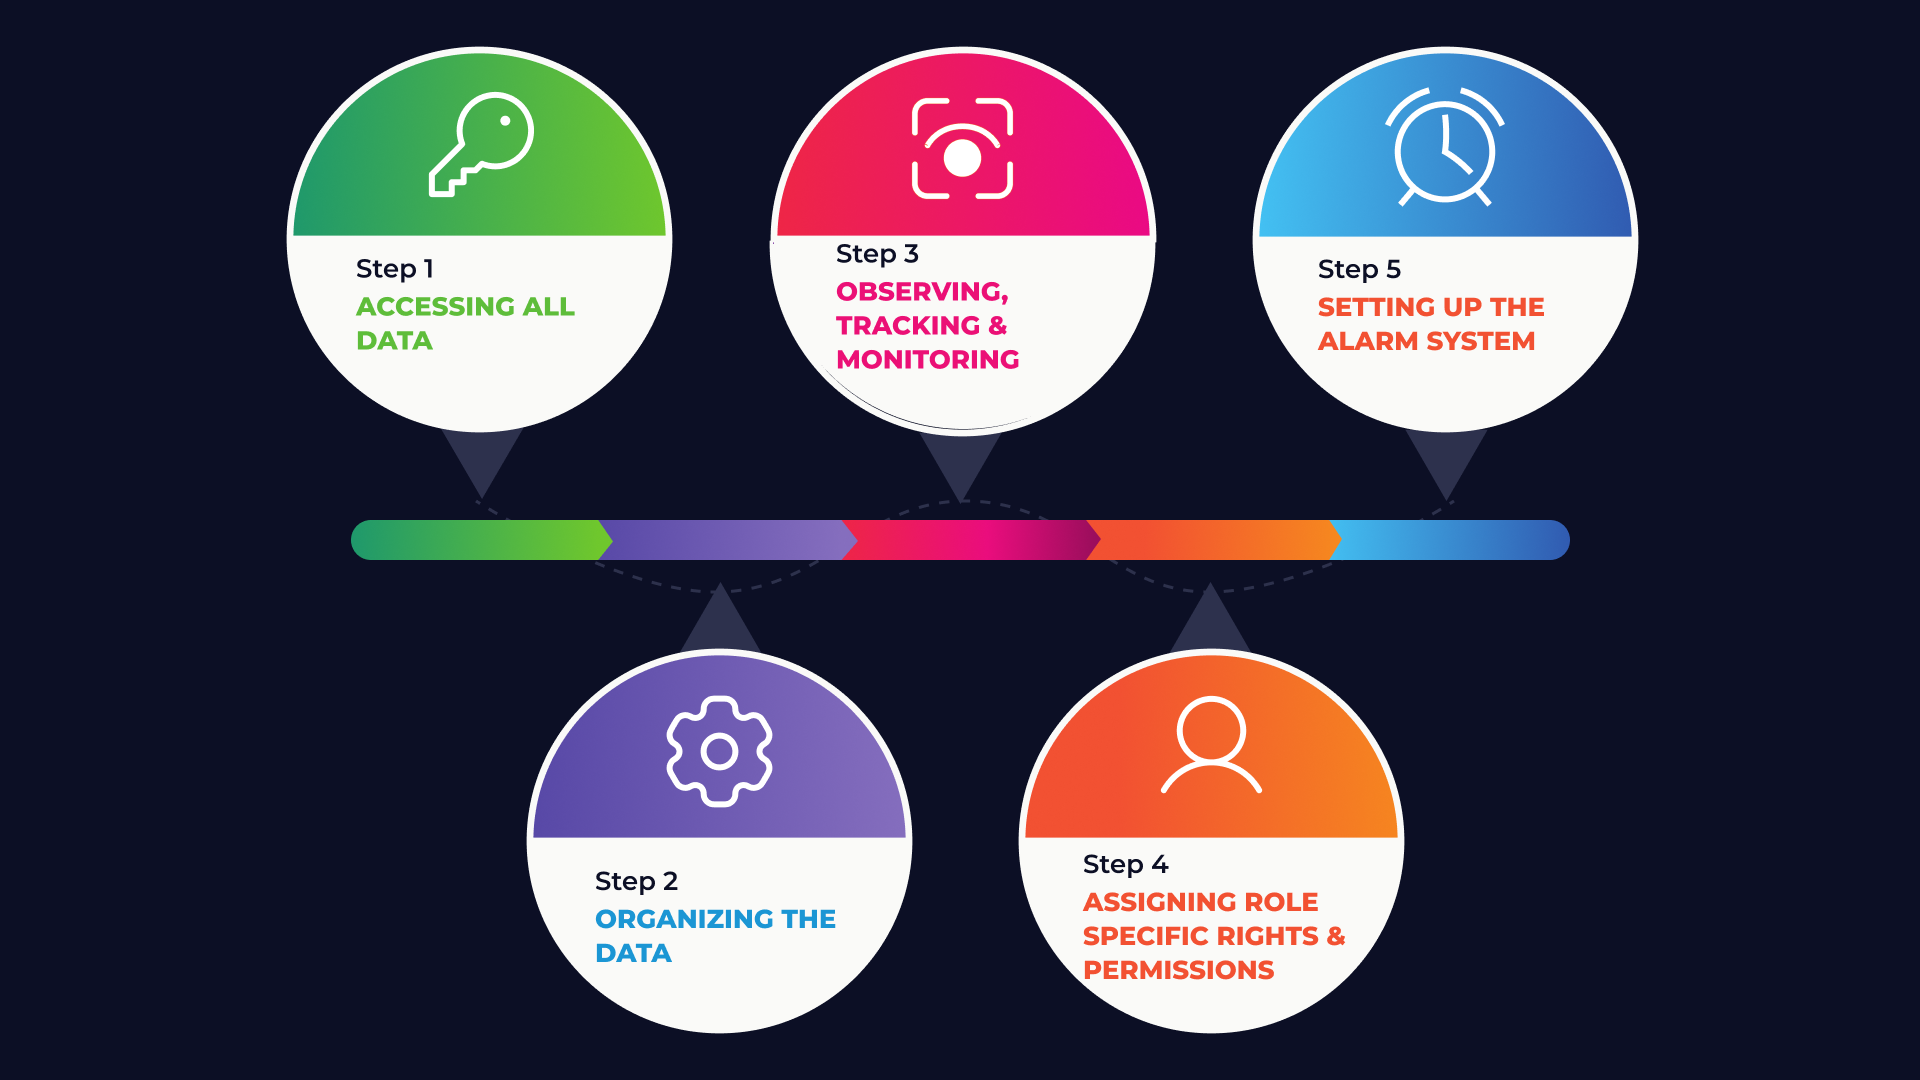
Step 1 – Accessing all data
As we said before, the data was spread across hundreds of different applications that ran thousands of jobs. Our first step was to access this data and collate them on our tool.
This required careful studying of each application platform and identifying the suitable APIs for each one of them, using which we could extract and collect the relevant data in the desired format. In doing so, we faced one big challenge for quite a few applications.
Challenge
Our client wasn’t using the latest versions of all application platforms. In some cases, they were using the older versions which weren’t compatible with the new APIs that were available. The APIs worked on the latest versions only. Therefore, we were unable to obtain data from such applications.
How we resolved it
Our team learned that there was an alternate way of acquiring data if not through the APIs. It was through command lines. Thus we managed to design a system to continuously get real time data from several applications onto our platform.
Step 2 – Organizing the data
Once we had built our data gathering mechanism, our next task was to organize the data in a way that even a lay person should be able to use it to get their work done.
Unique Job Page
Now, if you could scroll up, you’d see that one of our client objectives was to get a complete overview of all the details pertaining to any job, even for the new jobs that were being created as you read this, and the ones that will be created in the future. The best way to do this is to have a unique page for each job.
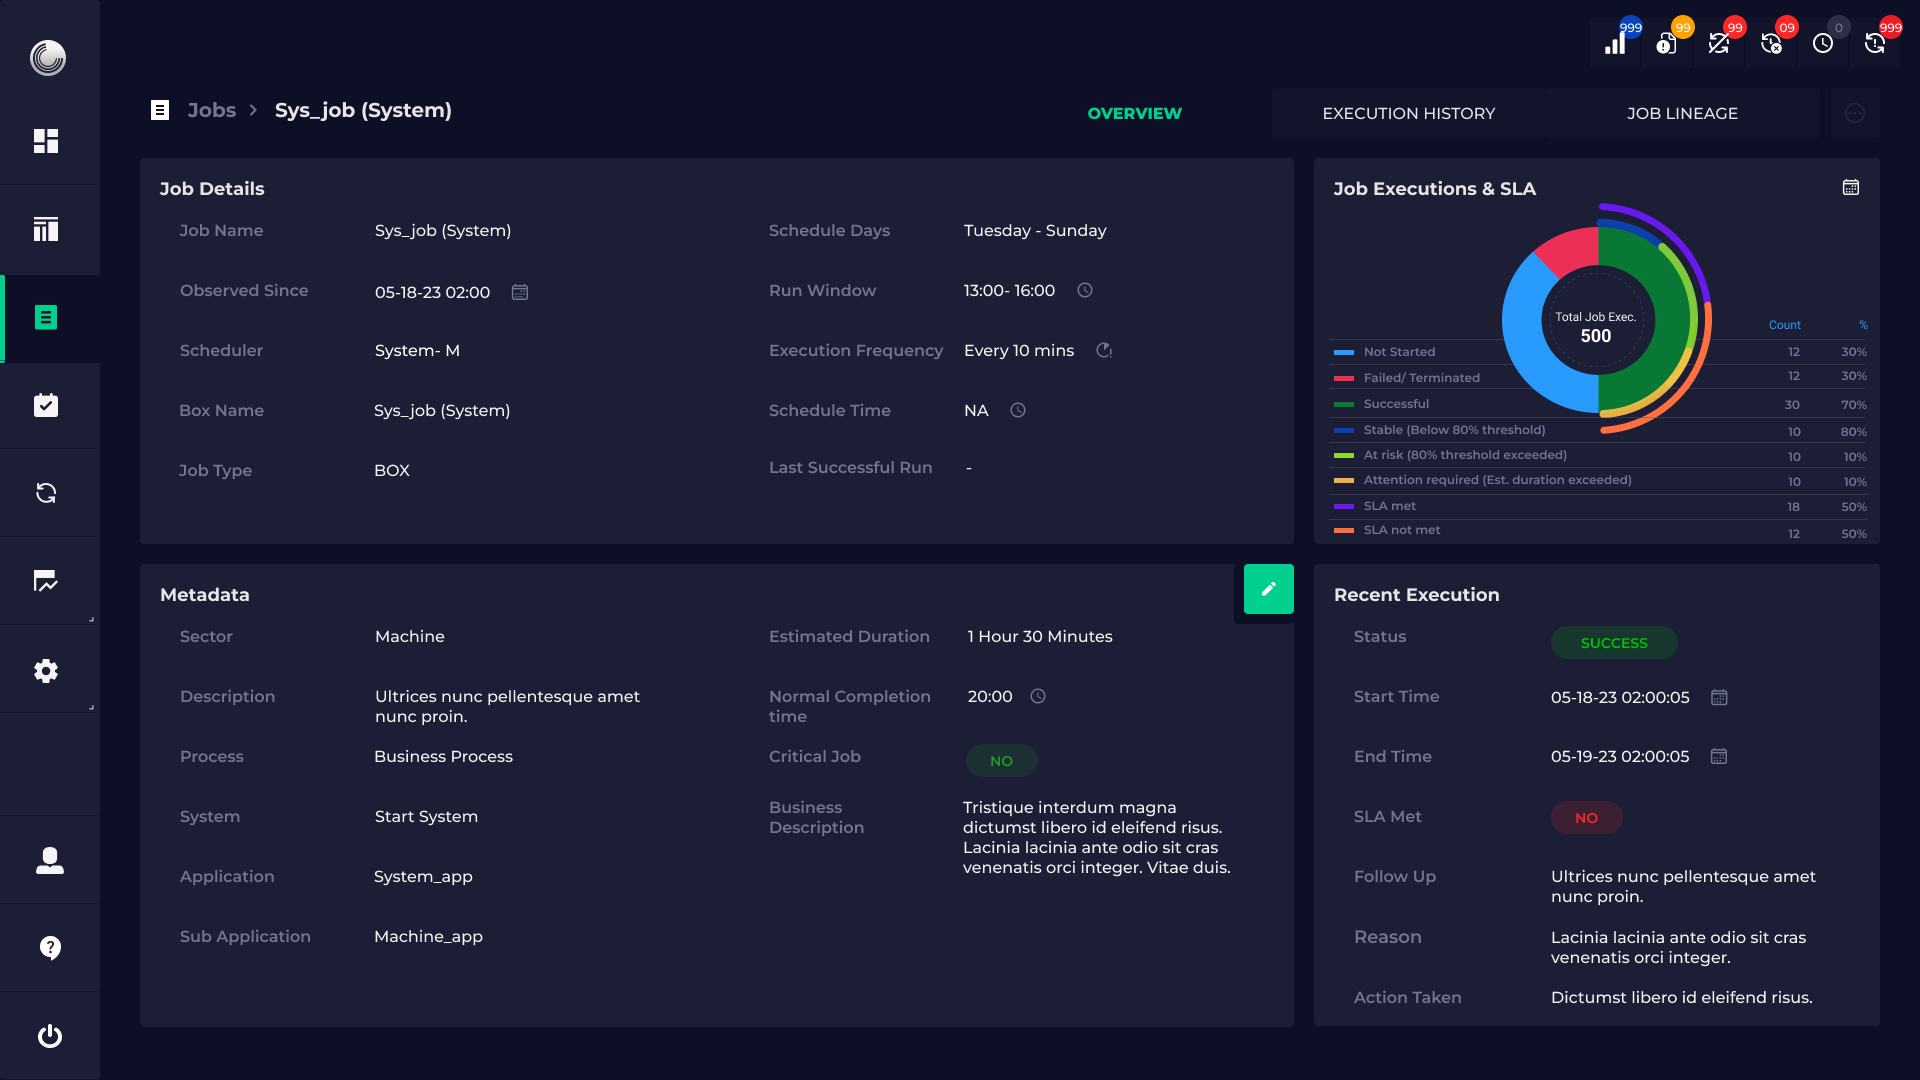
This page would contain every bit of information related to a particular job including when it was created, what application it belongs to, schedule time, run time, run history, information about recent runs, and other relevant data points. We also used graphs to enhance user understanding.
Dashboards
So, now the user could easily get the data for every job merely by visiting individual job pages.
However, the primary expectation from this tool was increased operational efficiency, smart planning, and decision-making.
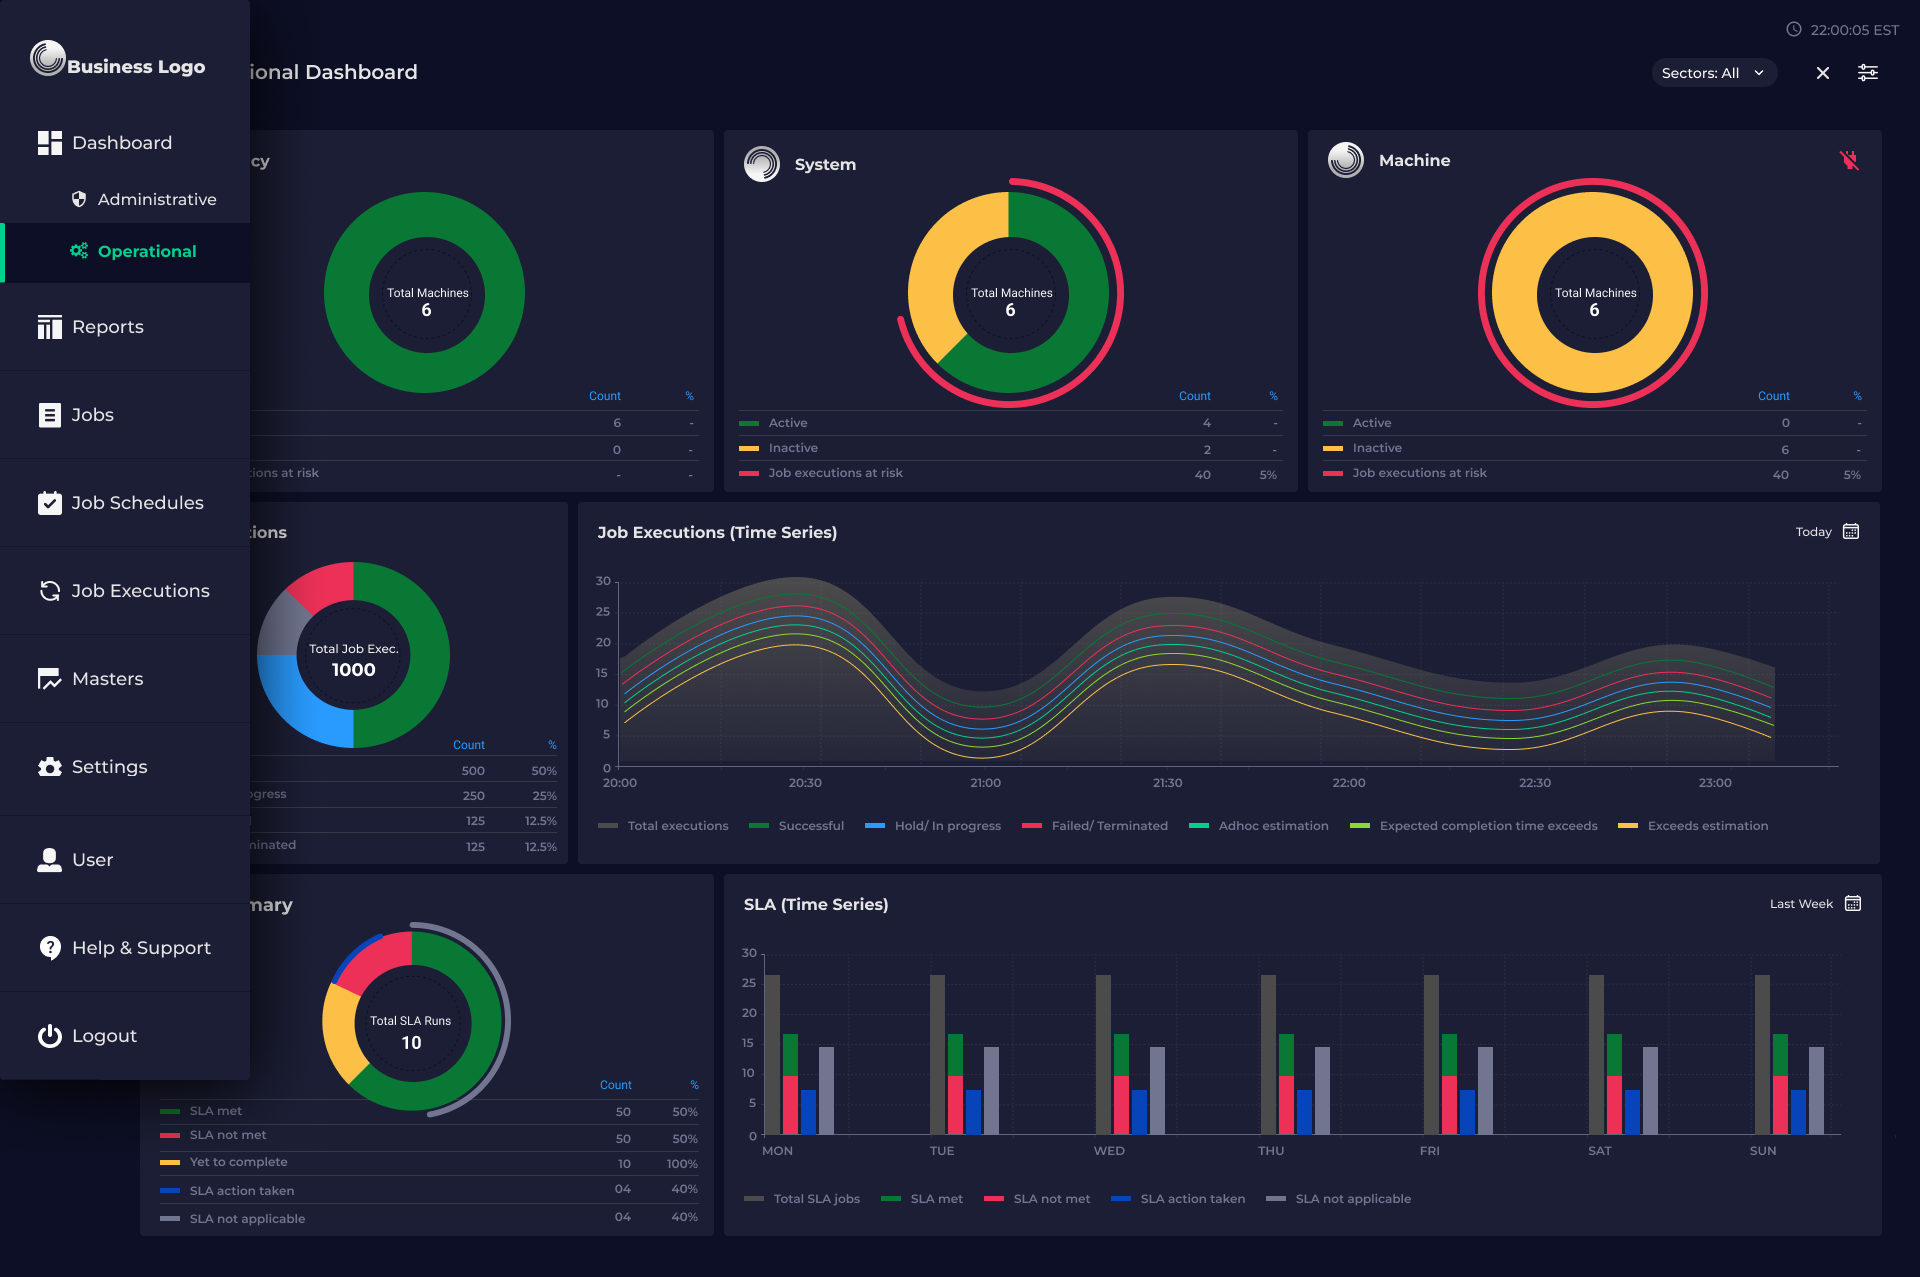
For that, we needed to build comprehensive, customizable, and interactive dashboards that would display real-time data making it possible for the users to manage every job within their system. In these dashboards, we employed several visualization techniques that would aid management of both, critical and non-critical jobs.
Challenge
A dashboard can only be effective if the data being sourced is accurate and up-to-date.
When we were developing the dashboards, we found missing details for a few jobs. And we didn’t want our users to see blank fields due to missing data.
How we resolved it
We provided an Edit button on every job page through which the users could manually enter the missing data for any job. This one-time activity gave them better control to improve the effectiveness of the tool.
Step 3 – Observing, Tracking, and Monitoring
Time is of essence for our client. A delay of even a second in identifying a malfunction could lead to huge business losses. Therefore, the tool should be able to generate reports with real time status drastically reducing human dependency and increasing operational speed.
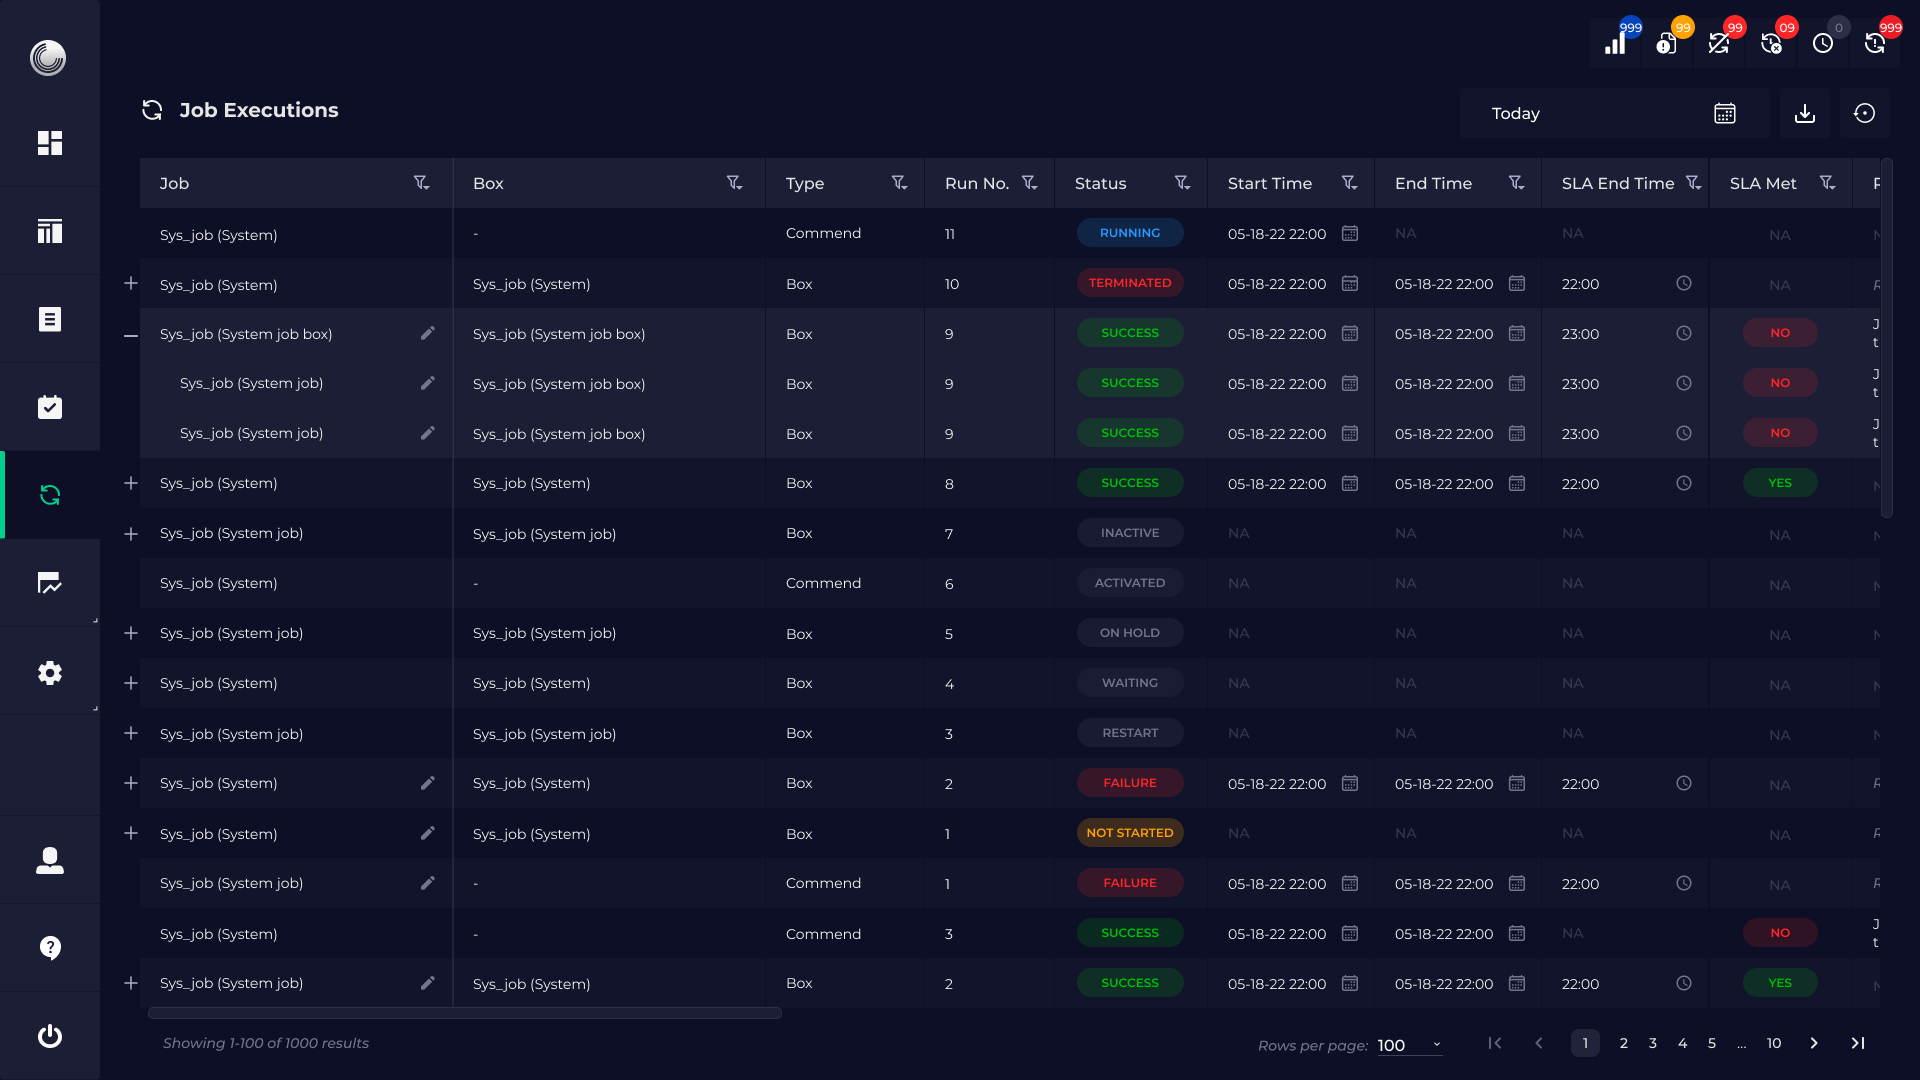
Through customizable reports, it became easy for the users and stakeholders to get a quick status update in real time. We devised provisions which allowed users to take the right action in case they spotted a discrepancy as well as update the same on the tool. This would enable all stakeholders to see the latest status and latest action taken for every job.
Challenge
There were plenty of use cases where the users had to access the list of all jobs running. And there were several other instances where the users had to track the jobs running on any given day. How do we accommodate both the requirements on our tool?
How we resolved it
We added a View option that let the user select how they wanted to view the data – Day wise or Job wise. This would help the respective teams to get the data they were looking for in the format they required.
Step 4 – Assigning Role Specific Rights & Permissions
When you have a system that’s processing terabytes of data, there’s always the risk of data exchanging wrong hands. Our tool’s built-in security assures that only employees of the organization have access to it. We also curated all the roles within the organization, analyzed the tasks performed by them, and identified the access rights and permissions that would be applicable for each role.
We then designed the permissions structure that would enable every stakeholders to access the required data and perform the tasks assigned to them seamlessly, without compromising on data security. We’ve taken special care using high-end security technology to protect classified business-related information and data.
Step 5 – Setting up the Alarm System
In our client’s existing SOP, every morning at 7 am a team would generate the report about the status of critical jobs and share it with the concerned stakeholders. Through our tool, we have eliminated the human dependency as well as all other overheads that came with it.
To make the system more robust, we have designed an Alerts & Notification system that lets the stakeholders quickly glance through any important issues that may arise from time to time simply by clicking on the Notifications icon on their screen.
This enables them to take the right action in time.
How Did We Do?
By the end of step five, we were able to deliver on every objective that we had written down for ourselves. Along the way, as you saw, there were quite a few challenges and problems. What we listed above were the major ones, however, there were plenty of tiny road bumps that we encountered throughout the duration of this project. Each of these hiccups came with their own lessons and learnings which made our team more adept, more prepared, and more confident than when we started.
However, what gave us the most satisfaction and happiness was to see how the system we built would contribute to the business of our Fortune 50 client. And the platform delivered.
Not only, did they get a smart observability and monitoring system, the tool gained intelligence as more data got fed into it each day. This AI capability of the tool enabled our client to forecast problems and eliminate potential issues which considerably increased their current as well as future operational efficiency.
They discovered many redundant jobs that had been running for months or years, yet didn’t serve any business purpose. Such jobs were removed from the systems thus, freeing up people’s time to do more important work. Thus, our tool helped our client to streamline their processes and operations while getting rid of redundancies.
It also helped them gather extremely helpful data about their resource utilization. For example, when they started using our tool, they soon figured out they had been spending excessively on about 20k licenses for a software, out of which, 12k licenses were not being used by their employees. Now, that’s a huge saving.
The impact that this tool has on our client’s business was tremendous, more so than we imagined. It will only increase with time, as the system takes it more data.
If your organization is facing similar challenges around data management, analytics, observation and monitoring, do reach out to us at [sales@seosaph.com] We’ll fix up a call and get the ball rolling!


